Like many readers, I’ve watched both a lot of college basketball and a lot of stock market in recent weeks. I’m not sure which has been more dramatic. This year’s NCAA Men’s Final Four was filled with momentum swings, lead changes, and unbelievable moments. Couldn’t the same be said of stock-price movements in 2025?
What was the more epic collapse—Duke squandering its lead against Houston or the April 2 selloff when the Trump tariff announcement sent the Morningstar US Market Index down 10.6% over the course of two days? Which was the better comeback—Florida winning the final after trailing by 12 points in the second half or the Morningstar US Market Index rallying nearly 10% on the tariff “pause” of April 9? Is Nvidia NVDA the Cooper Flagg of this market?
I have to say I’ve had much more fun watching hoops than stocks. Maybe it’s because I was neutral after Michigan, my alma mater, got knocked out of the Sweet 16 and my bracket got busted. Maybe it’s because my retirement and kids’ college tuitions aren’t on the line.
In any case, I decided to get some historical perspective. How common are wild days for stocks—both positive and negative? What are the conditions in which they occur? What do they mean for investors?
Big Days Come in Big Years – Sometimes
I examined 30 years of daily return history for the Morningstar US Market Index*, which represents 97% of stock market capitalization. I found only 43 days in which the benchmark either gained or lost more than 5%. Given that there have been more than 7,500 trading days since April 1995, that’s a minuscule number. Remarkably, three of the big days have occurred in April 2025.
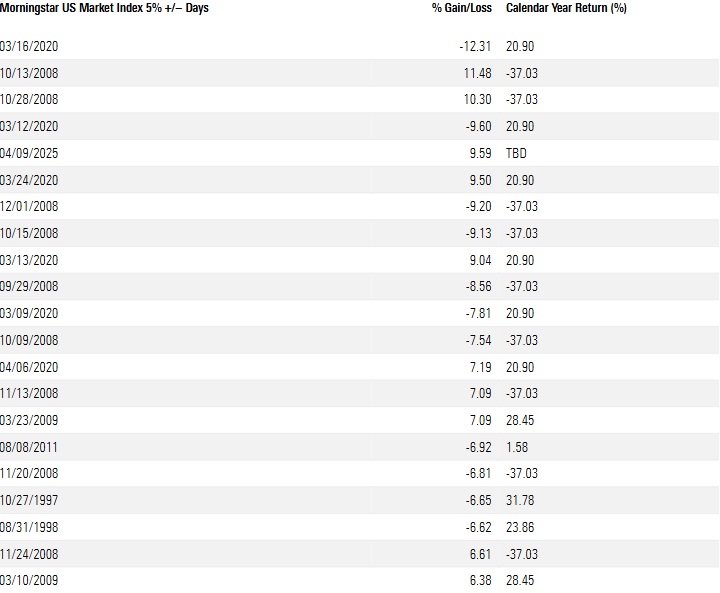
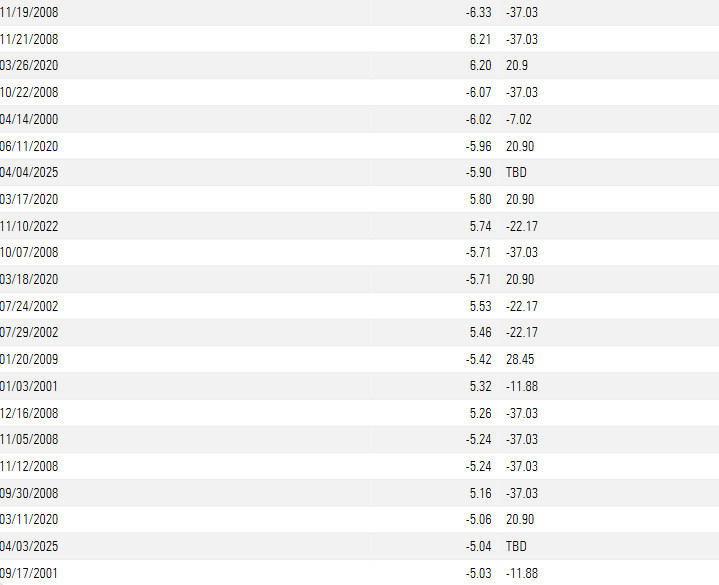
I count 19 positive days and 24 negative days on the list. I’m not surprised to see many of these extreme days happening during bear markets—like the bursting of the dot-com bubble in 2000 and the 2008-09 global financial crisis. What I’d forgotten is how many big positive days were mixed in with the down days in 2008, as investors processed policy responses or thought selling was overdone. I also note some big up days in July 2002, a year in which the Morningstar US Market Index fell 22%, thanks to accounting scandals like Enron and WorldCom.
On the flip side, I also see some big down days that weren’t part of down years. The most recent example is the worst single-day loss on the list—March 16, 2020, when a “pandemic panic” sent US stocks down 12.3%. The days preceding saw wild swings as investors tried to make sense of societal shutdowns. But stocks ended up recovering that year, thanks in part to massive fiscal and monetary stimulus. The Morningstar US Market Index ultimately posted a fantastic gain of 21% in calendar-year 2020.
Aug. 8, 2011, was another painful daily decline for stocks that wasn’t part of a bear market. Investors reacted badly to the downgrade of the United States’ credit rating by Standard & Poor’s in the wake of a Congressional debt ceiling standoff. Stocks lost nearly 7% in a single day. Yet, the Morningstar US Market Index ended 2011 in slightly positive territory.
The late 1990s is remembered as a tech-driven bull market, but there were also huge down days in 1997 and 1998 thanks to the “Asian Contagion” and Russian debt crisis. Stocks quickly recovered. The Morningstar US Market Index logged large gains in both those years.
You’ll also see the decline of Sept. 17, 2001, on the list above. That was the day the market reopened after the Sept. 11th terrorist attacks. US stocks ended that year down 12%.
The fact that stocks recovered in 2003 from the down years of 2001 and 2002 is important to keep in mind. I don’t know if the volatility we’ve seen in 2025 portends a horrible year for stocks or if things will settle down. What I do know is that, historically, market crashes that seemed monumental in their time ended up as blips on an investment growth chart that slopes up and to the right.
Don’t Miss the Up Days – Big and Small
As we saw on April 9, 2025, huge days can sometimes come out of nowhere, driven by fundamental or technical factors. Looking at the 19 days over the past 30 years in which the market gained more than 5%, some were part of market recoveries. The most recent were in March and April 2020, but you’ll also see days in early 2009 when stock prices started to bounce back from the financial crisis.
Being there for the market’s big up days is crucial. That’s why jumping in and out of stocks is a bad idea. Sitting tight allows a portfolio to benefit from unforeseen rallies.
But it’s also the case that extreme days—both positive and negative—are rare. Much of the long-term gain from stocks comes from the compounding effect of lots of small gains. For example, in 2023 and 2024, there were 0 days in which the market moved +/- 5%. Yet the Morningstar US Market Index gained roughly 25% in each year.
In that sense, investing is very different from college basketball. Every possession counts in a 40-minute single-elimination tournament game. Yes, markets might be covered like sports with all the hype and commentary (I see the irony of this statement coming in a commentary about markets), and there are traders betting on every tick, but long-term investors need not obsess over daily moves.
In investing, success is measured in years and decades, not days. A daily loss of 5% may be nerve-wracking. But if your investment goal is 10 years out, it need not be catastrophic. Morningstar research shows that investors who trade the least get the best results. You could always refocus your attention on the upcoming NBA playoffs. My Chicago Bulls are on tonight!
*The Morningstar US Market Index was launched in 2002 with preinception returns backcast.
Also published on Morningstar.com.
©2025 Morningstar. All Rights Reserved. The information, data, analyses and opinions contained herein (1) include the proprietary information of Morningstar, (2) may not be copied or redistributed, (3) do not constitute investment advice offered by Morningstar, (4) are provided solely for informational purposes and therefore are not an offer to buy or sell a security, and (5) are not warranted to be correct, complete or accurate. Morningstar has not given its consent to be deemed an "expert" under the federal Securities Act of 1933. Except as otherwise required by law, Morningstar is not responsible for any trading decisions, damages or other losses resulting from, or related to, this information, data, analyses or opinions or their use. References to specific securities or other investment options should not be considered an offer (as defined by the Securities and Exchange Act) to purchase or sell that specific investment. Past performance does not guarantee future results. Before making any investment decision, consider if the investment is suitable for you by referencing your own financial position, investment objectives, and risk profile. Always consult with your financial advisor before investing.
Indexes are unmanaged and not available for direct investment.
Morningstar indexes are created and maintained by Morningstar, Inc. Morningstar® is a registered trademark of Morningstar, Inc.